Softball throws

Softball throws

Pencil and paper
Overview
Using this Resource
Connecting to the Curriculum
Marking Student Responses
Further Resources
This task is about creating a back-to-back stem-and-leaf graph from raw data.
Classes 10MV and 10SP had a softball throwing competition. They measured their throws to the nearest metre. Here are their results.
 

  Class 10MV
 
Class 10SP
 
 
31    43     62    38    51

47    26     18    49    73

55    38     66    29    34

58    43     14    44    69

48    60     37

47    22    38    35    59

50    17    78    24    43

32    81    36    41    29

53    42    42    58    71

33    43

 
a)
 
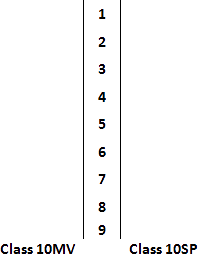
Complete this back-to-back stem-and-leaf graph, to show the results of the throws. You do not need to order the leaves on a stem.
 

Length of Throws of Class 10MV and 10SP Students


stem-leaf-graph-class-throws.png

Task administration: 
This task is completed with pencil and paper only.
Levels:
4, 5
Description of task: 
Students construct a back-to-back stem-and-leaf graph of softball throwing distances from two sets of data.
Curriculum Links: 
This resource can be used to help to identify students' ability to display multivariate data by constructing a back-to-back stem-and-leaf graph.
Learning Progression Frameworks
This resource can provide evidence of learning associated with within the Mathematics Learning Progressions Frameworks.
Read more about the Learning Progressions Frameworks.
Answers/responses: 
   

Y10 (08/1999)

2 marks
(for all correct)

1 mark
(for 1-2 errors)


or

NOTE: The data may be ordered differently along each stem.
If the data for 10MV is put above "Class 10SP" and vice versa, count this as 1 error.
all correct –
moderate

1-2 errors –
easy

 
NOTE: Commas separating numbers were accepted, but are not standard usage.