Pies and buses

Pies and buses

Pencil and paper
Overview
Using this Resource
Connecting to the Curriculum
Marking Student Responses
Working with Students
Further Resources


a)
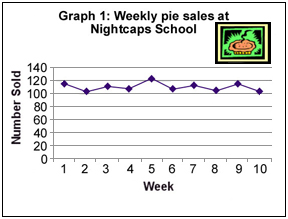
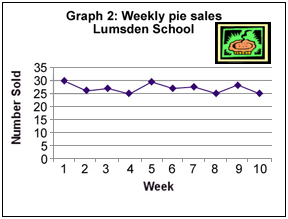
Graphs 1 and 2 show the weekly pie sales at Nightcaps and Lumsden Schools. 
Compare the pie sales and the trends in sales between the two schools over the weeks shown.


b)
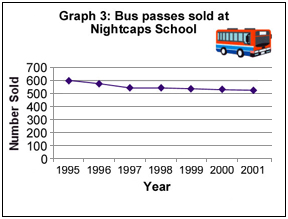
Graphs 3 and 4 show the bus pass sales at Nightcaps and Lumsden Schools.
Compare the bus pass sales and the trends in sales between the two schools over the years shown.


Task administration: 
This task is completed with pencil and paper only.
Level:
5
Description of task: 
Students are required to compare sales represented on line graphs of the total sales and the pattern of sales over time.
Curriculum Links: 
Key competencies
This resource involves exploring and using patterns and relationships in data and communicating their findings. These relate to the Key Competencies: Thinking and Using language, symbols and text.


Learning Progression Frameworks
This resource can provide evidence of learning associated with within the Mathematics Learning Progressions Frameworks.
Read more about the Learning Progressions Frameworks.
Answers/responses: 


Y10 (11/2002)

1 mark
 
1 mark

a)

Nightcaps sold more pies than Lumsden or similar
statement.
The pattern of sales between the schools followed
a similar trend, (showed little variation) or similar
statement.
NOTE: Do not accept if students give actual details of individual weeks, i.e., if they start arguing details. E.g., every 2nd week sell less, week 1 and week 5 showed …

easy
 
difficult

2 marks
or
 
1 mark

b)

Decline in bus passes for both schools by the same
amount or similar statement, (they may or may not
mention a variation in sales).
Bus pass sales are the same, but there is no mention of a decline (they may or may not mention a variation in sales).

very difficult

moderate

Diagnostic and formative information: 
  Common error Likely misconception
a) Statements giving actual details of individual weeks. Does not actually look at the overall trend.
b) Statement highlighting a decline in bus pass sales and some variation between the schools.
Statement highlighting Nightcaps slow decline (or staying steady) and Lumsdens fast decline in sales.
Does not compare the y-axis scales.