Cricket scores

Cricket scores

Pencil and paper
Overview
Using this Resource
Connecting to the Curriculum
Marking Student Responses
Further Resources
This task is about reading information from a line graph.
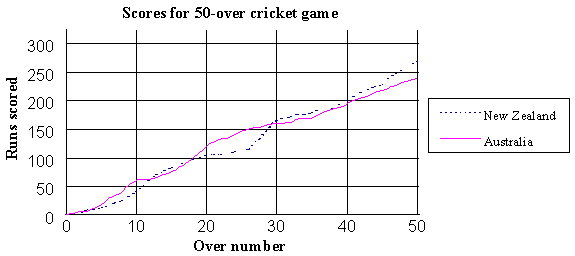
 
 
Here is a graph of the scores in a 50-over cricket game between New Zealand and Australia.
 
a)
i)
 
ii)
 
What was New Zealand's score after 40 overs? __________
 
What was the difference between the two teams' final scores? __________
 
b)
 
Which team scored most runs
 
 
i)
 
ii)
 
iii)
 
in the first 10 overs? ____________________
 
in the last 10 overs? ____________________
 
between overs 20 and 30? ____________________
 
c) i) Circle the part of the graph that shows when New Zealand was scoring at the fastest rate.

 
  ii)
Explain how you can tell that this is the fastest rate that New Zealand scored at just by looking at the graph.


Task administration: 
This task is completed with pencil and paper only.
Level:
5
Description of task: 
Students answer questions about a line graph showing scores in a cricket game. An understanding of slope is needed.
Learning Progression Frameworks
This resource can provide evidence of learning associated with within the Mathematics Learning Progressions Frameworks.
Read more about the Learning Progressions Frameworks.
Answers/responses: 
  Y10 (06/2000)
a) i)
ii)
200 [accept 200-205]
30 [accept 20-40]
very easy
easy
b) i)
ii)
iii)
Australia
New Zealand
New Zealand
difficult
c) i)
ii)
A circle around the graph at overs 26-30.
Because the graph is the steepest.
moderate
easy