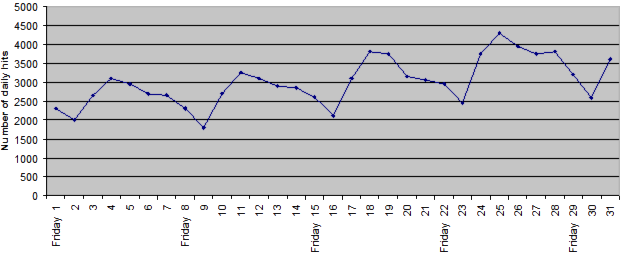
Website hits

| Y10 (06/2009) | |||
| a) |
i) ii) iii) iv) v) |
False True True False True |
very easy very easy very easy very easy very easy |
| b) |
|
Writes a description that includes both these features: Any 1 of:
Mentions just one of:
|
both features - moderateone feature - very easy |
NOTE: Students were not credited with commenting on the cyclical nature of the graph if they mentioned just one (but not both) of: "Mondays have the highest number of hits" or "Saturdays have lowest the number of hits." The former of these merely reiterates one of the initial statements in part a). If students mentioned both, this was seen as evidence of seeing the cycle.
Examples of student responses that mentioned both the weekly cycle and the upwards trend (30 students had both).
- [It] shows the general increase while also containing its own weekly cycle.
- The number of hits rapidly increased then slowly dropped over the week but grew more each [subsequent] week.
- The hits increased mostly during May and the graph had a pattern over each week.
Examples of student responses that described the weekly cycle but not the trend (41 students)
- The number of hits went up during the weekend and Monday. After that they slowly decreased until the next weekend.
- The number of hits dropped on Saturdays and peaked on Mondays.
- Monday is the most popular day and the pattern repeated.
Examples of student responses that described the upwards trend but not the cycle (13 students):
- The rates increase every week in May.
- The amount of people visiting the website is increasing each week.
This resource is about responding to claims made about a graph. Responding to statistical claims is called "statistical literacy". Students should also be able to identify and describe the major overall information that a graph shows. The two main features of this time series graph are:
- There is a cycle (or pattern) that repeats each week.
- There is an upward trend in the graph.
| Common responses that ignore the two major data features of this graph | |
| b) |
Makes statements about the readability of the graph. Examples:
|
| b) |
Gives features that good graphs should have. Examples:
|
| b) |
Makes statements about the readability of the graph. Examples:
|
- Ask the student to say something important about the overall patterns of this graph, not just statements about particular points on the graph.
- If they cannot, give them leading questions such as:a) Tell me what has happened each Monday? Each Saturday? Each of the other days?b) How did early May hit levels compare with those in late May?
- Place a transparent ruler over the graph, and ask students what they now notice. Allow them to move it around until they find a "line of best fit". This should slope upwards, and the weekly cycle should become even clearer.
Gives correct statements about the graph that ignore the weekly cycle or upwards trend
- Assure the student that they have made a correct statement.
- Ask them if they can say something else that summarises the whole graph (i.e. all the points plotted on it) rather than just one point on the graph.
- If they can not, give them leading questions such as:a) Tell me what has happened each Monday? Each Saturday? Each of the other days?b) How did early May hit levels compare with those in late May?
Students who correctly identify the trend and the cycleChallenge them to:
- Suggest why the weekly cycle or the upwards trend may have occurred.
- Give ways in which the graph may be used. (See the box below entitled Responses that show extra insight.
| Responses that show extra insight | |
| b) |
Gives a reasonable explanation about why there is a weekly cycle. Examples:
|
| b) |
Gives a reasonable explanation about why there is an upwards trend. Example:
|
| b) |
States what can be done with as a result of the graph. Examples:
|
NOTE: These responses were uncommon and were not asked for, but show good insight into making inferences from a graph. Discussing these inferences might be a way to help students make meaning of the graph.

