Time spent helping at home

Time spent helping at home

Pencil and paper
Overview
Connecting to the Curriculum
Marking Student Responses
Working with Students
Further Resources
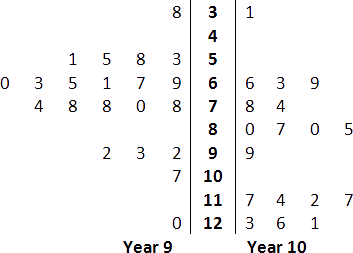
Some students decided to measure the time spent helping at home by Year 9 and Year 10 students. They asked a sample of students to record the time they spent helping at home one night.
They displayed their results on this back-to-back stem-and-leaf graph.
 
Time spent helping at home (in minutes)
 
time-homework-stem-leaf.png


a)
Redraw the graph putting the numbers within each stem in order.
time-homework-empty-stem-leaf.png
b)
What was the least time spent helping at home by any of the students? __________ minutes
 
c)
What was the median time spent helping at home by
 
 
i)
 
ii)
the 21 Year 9 students? __________ minutes
 
the 18 Year 10 students? __________ minutes
Level:
5
Description of task: 
Students redraw, and re-order, the numbers in a back-to-back stem-and-leaf graph and then answer questions about the new graph.
Answers/responses: 
 

Y10 (06/2000)

a)

8
 
1  5  8  3
0  3  5  1  7  9
4  8  8  0  8
 
2  3  2
7
 
0
3
4
5
6
7
8
9
10
11
12
 
1
 
 
6  3  9
8  4
0  7  0  5
9
 
7  4  2  7
3  6  1
Year 9       Year 10
 
[Treat as 1 error if either or both of the stems are consistently ordered in an opposite way]

2 correct - easy
 
1 correct - very easy

b)

31

easy

c)

i)
ii)

69
86

difficult

Diagnostic and formative information: 
  Common error Likely reason
c) i)
   ii)
60
80
Counting along each stem the wrong way (from outside to inside).
c) i)
   ii)
72.48
91.33
Calculates mean not median.
c) i)
   ii)
4.38
4.55
Calculate mean of the numbers in the leaves.