Rates of dissolving

Rates of dissolving

Pencil and paper
Overview
Using this Resource
Connecting to the Curriculum
Marking Student Responses
Further Resources
This task is about how temperature affects dissolving of sugar.
Amanda and Ned wanted to find out how much sugar would dissolve in water at different temperatures. For each temperature they tested, they put 100 mL of water into a cup, and then added sugar until no more would dissolve. 
Here are their results.
 
Temperature (°C) Amount of sugar dissolved (grams)
10 20
30 60
40 90
60 120
80 185
 
a)
Draw a line graph to show the above results. The first point has been done for you. 
Remember to make sure your graph has a title and a label with the correct unit for the bottom axis.
 
 
Title: ____________________________________________________
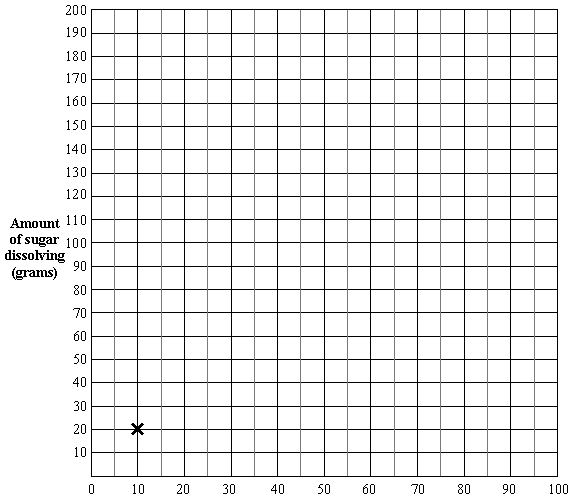


Label: ______________________________ (Unit: _______)


b) Write a sentence about the temperature of the water as it increases and the amount of sugar that dissolves.


c)
Here are some results for salt dissolved in water of different temperatures.
 
Temperature (°C) Amount of salt dissolved (grams)
10 30
30 30
40 30
60 30
80 30
 
 
Write a sentence about the temperature of the water and how much salt will dissolve.


Task administration: 
This task can be completed with pencil and paper.
Levels:
3, 4
Description of task: 
Students construct a line graph from provided data, and then write a summary about the data.
Curriculum Links: 
Science capabilities
The capabilities focus is brought about by the conversations you have and the questions you ask.
 
Capability: Interpret representations
This resource provides opportunities to discuss the relative benefits of using tables or graphs to convey the same set of data.
Science capabilities: 
Answers/responses: 


Y5 (09/2002)

Y6 (09/2002)

Y7 (09/2002)

Y8 (09/2002)

Appropriate title given

very difficult

very difficult

very difficult

difficult

An incomplete title given

difficult

moderate

moderate

moderate

Line graph drawn

difficult

moderate

moderate

easy

All points plotted correctly

moderate

easy

easy

easy

1 mistake made in plotting

easy

easy

very easy

very easy

x axis labelled: Temperature

difficult

moderate

moderate

easy

x axis unit: °C

difficult

difficult

moderate

moderate

b) More sugar will dissolve as the water temperature increases.

difficult

difficult

moderate

moderate

c) The amount of salt that dissolved was always the same (in different water temperatures).

difficult

difficult

moderate

moderate